Visualization of an NBA match
LA Clippers V.S. Denver Nuggets
Xiaozhou Zou and Yuxuan Xia - Dec 13, 2016
General Idea:
In this project, an NBA match is visualized. This visualization is made for a basketball fan who wants to understand the whole trend of the game as well as the key factors that lead to success or failure. Suppose such a basketball fan missed an important game, LA Clippers V.S. Denver Nuggets for example. When reviewing this game, if he/she only reviews the statistics, the basketball fan will miss lots of details in the game, such as positions of scoring and various technical events along the time line. On the other hand, if that basketball fan watches the highlight collection, although lots of details are obtained, he/she has no idea the whole trend of the game and the overall performances of all players. Our goal is to give the basketball fan a view of the game which includes the overall tendency of the game, rich information about the players and an insight on key factors that lead to a victory or defeat. The following is our embedded interactive visualization.
Introduction Video
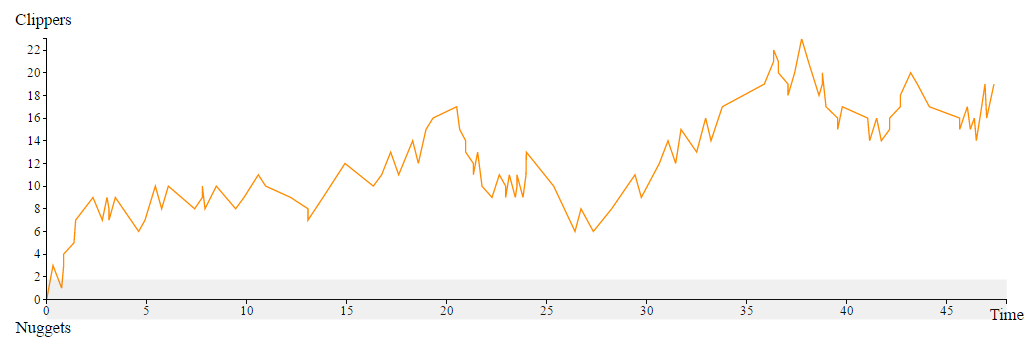
Score Difference Linechart:
To realize our goals, we use a score difference linechart which we consider as an effective way to show the trend of the game. It is very possible that the basketball fan wants to know the detailed information in a certain period of time of a match. Taking that into consideration, we add a brush on the horizontal axis of the score difference linechart. by brushing on a certain period of time, the user will get the corresponding information in that period of time on other coordinated charts. The score difference linechart itself, to avoid information overload, will remain unchanged.
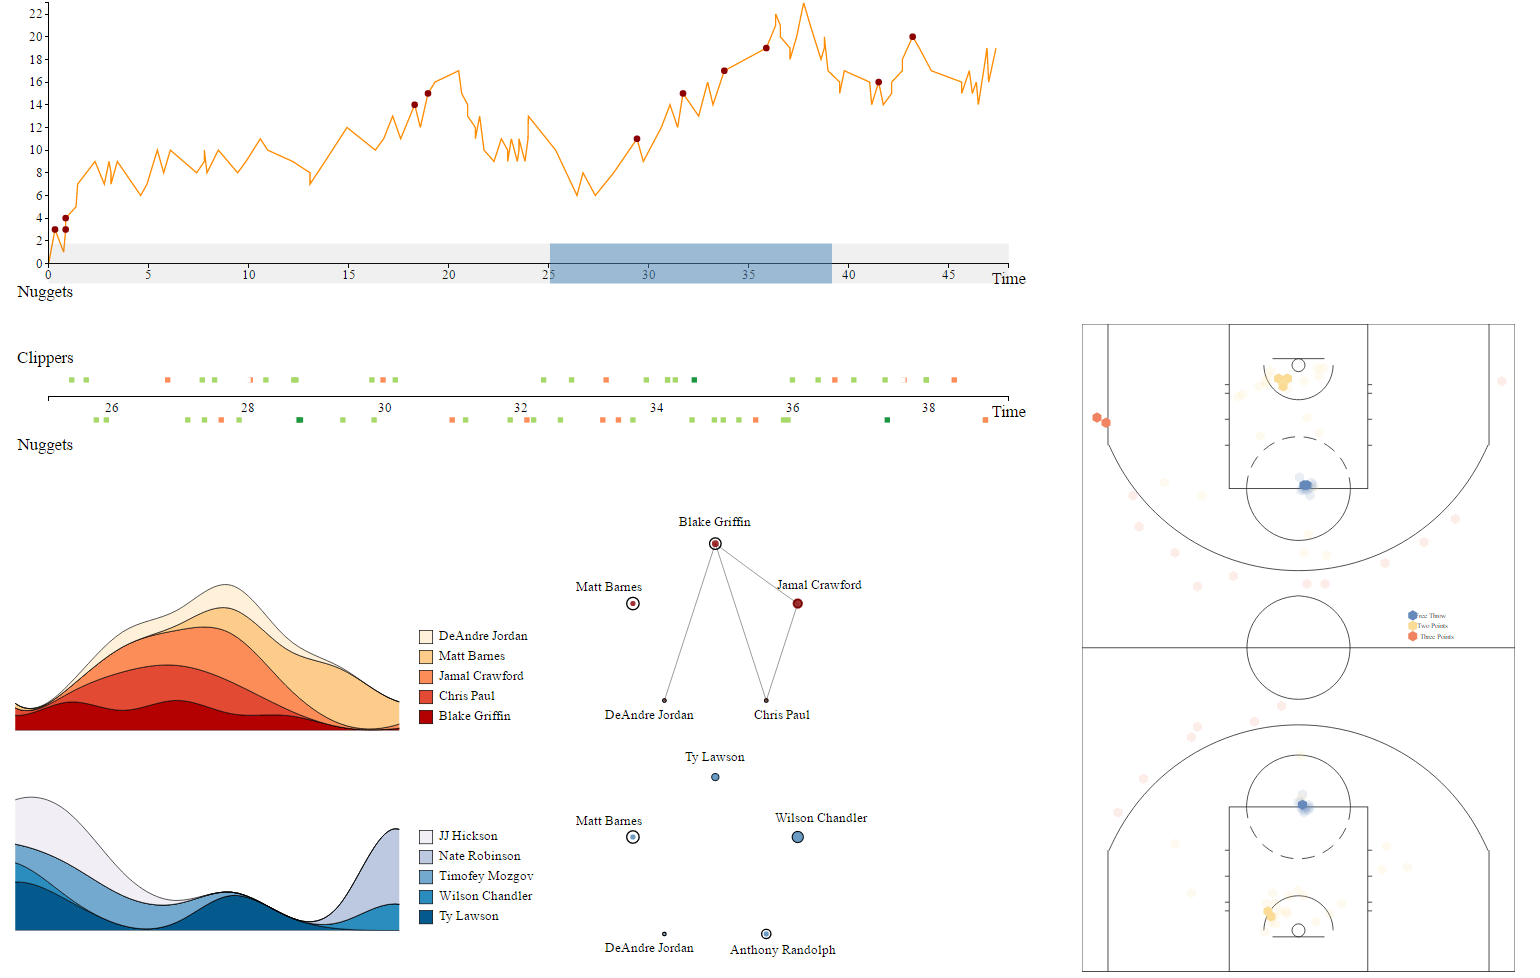
Event Chart:
Event chart shows events other than scoring. Those events, including rebound, turnover, block and personal foul, are distributed along the time line and represented by different colors. This event chart can respond to the brushing event, showing the events corresponding to a certain period of time.
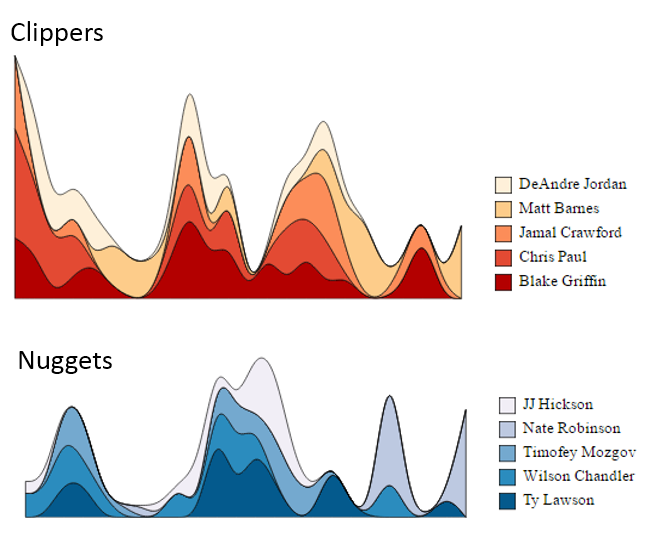
Performance Streamgraph:
Streamgraph is used to show the overall performances. In each team, players among the top five performances are filtered to be shown on the streamgraph. The performance is calculated based on technical events such as scoring, rebound, assistance and block. Each stream represents a player. The wider the stream, the higher the performance. Hovering the mouse on a stream, other streams will look more opaque. Clicking on a stream, the scoring events of that player, represented by little dots, will be shown on the score difference linechart and the shoot chart. The user can see in detail the information of that scoring event if he/she hovers the mouse on the little dots on the linechart. Brushing on the horizontal axis of the score difference linechart, the streamgraph will change accordingly, showing the performance of the players in that period of time.
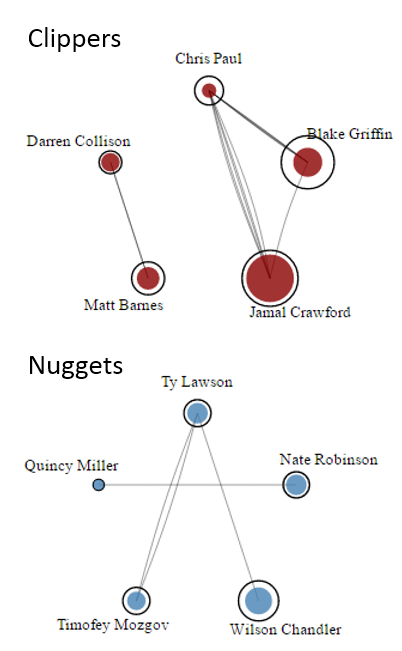
Attack Nodelink Graph:
The node-link graph is used to show the chemistry of the team in the attack. In each team, players among the top five attack efficiencies are filtered to be shown on the node-link graph. The attack efficiency is calculated based on the scoring events and assistance events. For each node, the outer circle shows the player's expected score, which increases as the player makes more shooting attemps. The inner circle shows the player's actual score. If one player sends an assistance to another, there will be a link between the two nodes represented by these two players. By brushing on the horizontal axis of the score difference linechart, the node-link graph will be updated, showing the corresponding chart in the selected period of time.
Shootchart:
The shootchart is used to show the positions of the scoring. There are three types of events on chart: two points, three points and freethrow. They are represented separately by blue, yellow and red. The shoot chart will be updated when any stream in the streamgraph is clicked. The scoring events of the selected player will remain unchanged while that of other players will be more opaque. The shoot chart can also interact with itself. By clicking any point on it, all scoring events of other players will be more opaque, looming all the scoring events of the player who makes the selected scoring event. The main purpose of having this shoot chart is to show the spatial distribution of the scoring events of a player as well as that of the whole game. This chart will also respond to the brushing event, showing the corresponding scoring events in the selected period of time.
Reviewing a Game by our Visualization: a User Story
In this part, we try to understand the visualization from a user's perspective. On seeing the score difference linechart, which is used to show the overall trend of the game, the user knows that although there are several back and forth in the game, this game is basically an overwhelming victory of LA Clippers over Denver Nuggets.
So what leads to that victory? The user looks at the node-link graph that describes the attack efficiency and finds that Clippers' leading players get more scores and have more cooperation. This partially explains the game result.
Then the user starts to compare the the streamgraph between the two teams since the streamgraph describes the overall performances of leading players in each team. By comparing the two streamgraphs, the user finds that the Clippers gives the Nuggets a huge strike at the begining of the game, establishing their advantage at a very early stage. Such advantage is not enlarged in the first half game. However, In the third quarter, the stream of Clippers looks like a torrent and that of Nuggets a brook, leading Clippers to a decisive advantage and making the rest of the time in the game meaningless.
Is is very interesting what constitutes this fatal attack. To know more details, the user selects the time period from 27 minute to 38 minute. Then on the event chart we find more red squares on the Nuggets' side than the Clippers' side, showing that more personal fouls and turnovers are commited and less beneficial events are done. The nodelink graph shows the exellent performance of Jamal Crawford and more cooperations among Clippers players, making a strong contrast with the ordinary performances of the Nuggets players.
Being interested in this exellent player, our user may click Jamal Crawford's stream to see his scoring events in the whole game. The event dots on the score difference linechart shows that his scoring events happen frequently at the start of first quarter and in the whole third quarter, alignling with the time period when Clippers establish their advantages. This tells us that Jamal Crawford is a crucial factor that leads to the success of Clippers in this game. On the shoot chart, the user knows that Jamal Crawford's scores are a mix of two points, three points and freethrows. Such scoring pattern makes him harder to defend.
After fully exploring our visualization, it is not hard for our user to draw the conclusion that good team cooperation (this is due to the organization of Chris Paul) and the decisive performance of Jamal Crawford are the two key factors that lead to their overwhelming victory. Nuggets, on the other hand, does not have a leading player and good team cooperation, which causes the failure.
Credits and Links
This project was created by Xiaozhou Zou and Yuxuan Xia for a graduate course in Data Visualization at WPI taught by Lane Harrison. D3, an open-source project were used under the MIT License. Data is obtained from the SportsRadar API.
Click
here to view the data we use.
Click
here to view the our process.